Over the past five years, the Reserve Bank of Australia (RBA) has cut the cash rate from a high of 4.75% in 2011 to a low of 1.50% in August 2016.
During this period, Australian households have borrowed increasingly large amounts of debt, which are being financed at lower and lower rates. One consequence of this borrowing is that when the interest rate cycle turns and the RBA does start to increase the cash rate, the rate that is achievable will likely be structurally lower than those observed before the global financial crisis (GFC). We expect that 3% is likely to be the ceiling level for the Australian cash rate as opposed to the ‘normal’ 5% level we saw through the 1990s and 2000s.
Gearing high but serviceability manageable
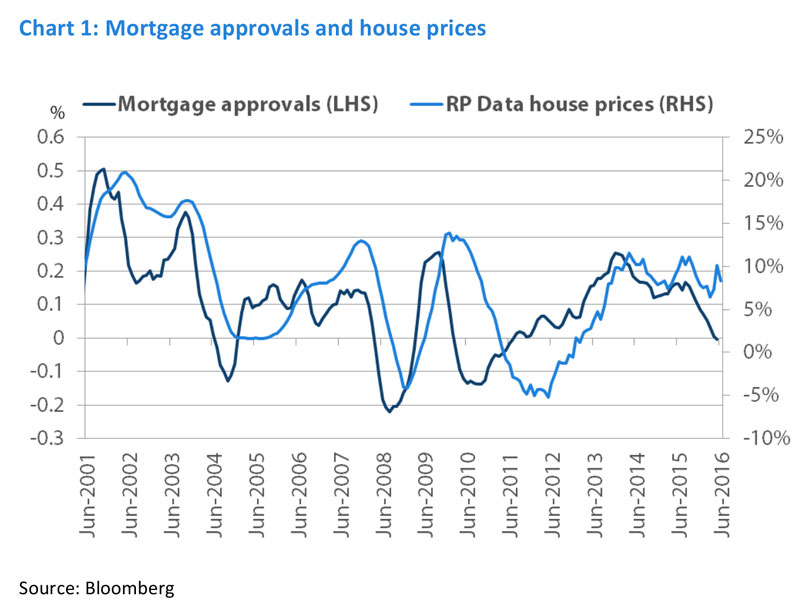
Australian property prices have seen strong performance over the past three years due to the combination of low interest rates and readily available credit. This has led Australian households to increase leverage to historically high levels. The level of mortgage approvals has seen year-on-year growth since 2011, with both 2014 and 2015 being characterised by a large number of investor approvals. Although the approval rate started slowing in 2014 and 2015, it was still growing year-on-year. However, the crackdown on investor lending in September 2015 saw a sharp fall back to flat.
As property prices increase, larger mortgages are required to service purchases and this has led to increasing levels of household debt. Chart 2 shows the leverage ratio of the household sector in both Australia and the US (calculated by dividing the level of household debt by GDP). In Australia, the ratio paused momentarily after the GFC, before continuing higher as the RBA reduced interest rates, while US households began to gradually deleverage. Many commentators state that the high level of Australia’s household debt increases the risk in the system, leading to potential vulnerability in both house prices and the wider economy. This idea is particularly prevalent in international circles and many often point to the stark difference between household leverage in the US vs. Australia. However, focusing solely on leverage overlooks the serviceability of the borrowing.
When the serviceability of the loans is taken into account, it becomes apparent that while leverage is high, the percentage of disposable income being used to repay those loans remains relatively low—almost 20% lower than just prior to the GFC.

In order for the high leverage ratios to become problematic, households’ ability to service the loans would have to fall. This could occur either via mortgage rates increasing as a result of the RBA raising rates, or through a fall in gross disposable incomes, most likely due to rising unemployment. To determine households’ level of vulnerability, we decided to analyse what effect rising interest rates would have on serviceability, which led us to the conclusion that a 3% cash rate would likely be the top of the next hiking cycle.
Mortgage serviceability in a rising interest rate environment
When analysing Australian household debt, the key question is: how much of an increase in interest rates can households withstand before they start to show signs of stress? Using current levels of disposable income and assuming the mortgage rate margin remains stable (level of mortgage rate over the official cash rate), then serviceability begins to become stretched when the cash rate rises above 3% according to our analysis.
In the scenario analysis shown in Chart 3, we estimated the mortgage serviceability ratio under a cash rate of 3.25% and a mortgage rate of 6.75%. The result was that interest costs would rise to an estimated 50% of disposable income, in line with levels that stretched households in both 2007 and 2011.

Over the past five years, the bond market has been waiting for a return to ‘normal’, i.e. the typical 5% interest rate which was observed through the 1990s and 2000s. However, this ‘normal’ rate seems increasingly distant and the lower interest rates go, the harder it will be to return to a 5% cash rate as borrowers leverage up on cheap debt. Based on our analysis, we expect it would be difficult for the RBA to increase the cash rate much above 3% without causing serious knock-on effects to the economy.
Effects of rising leverage on the broader economy
In December 2014, the Australian Prudential Regulation Authority (APRA)[1] reinforced what it believed to be sound residential mortgage lending practices. APRA stated that in its view, ‘prudent serviceability policies should incorporate a serviceability buffer of at least 2 per cent above the loan product rate, with a minimum floor assessment rate of 7 per cent’. This would put a healthy buffer in lending standards and mean that individual borrowers will be able to withstand higher interest rates.
However, the effects on the individual are different to the effects on the broader economy. In order to assess the effects of rising leverage on the economy, we looked at how much pressure an increase in the cost of borrowing would place on interest repayments. As at the end of 2015, a 1% increase in interest rates would have resulted in Australian households collectively paying an additional AUD 20 billion in interest per year (amounting to a little less than one month’s total retail sales), or an additional 7% of disposable income. Chart 4 shows the significant increase in the interest costs as a result of a cash rate rise over the past couple of decades—in 2005, that same 1% increase in interest rates would have resulted in an additional AUD 10 billion in interest per year. Thus, while borrowers might be able to withstand that slightly higher rate, the effect on the broader economy would be felt more quickly than in prior interest rate tightening cycles even though the outright level of interest rates would be lower than in previous cycles.

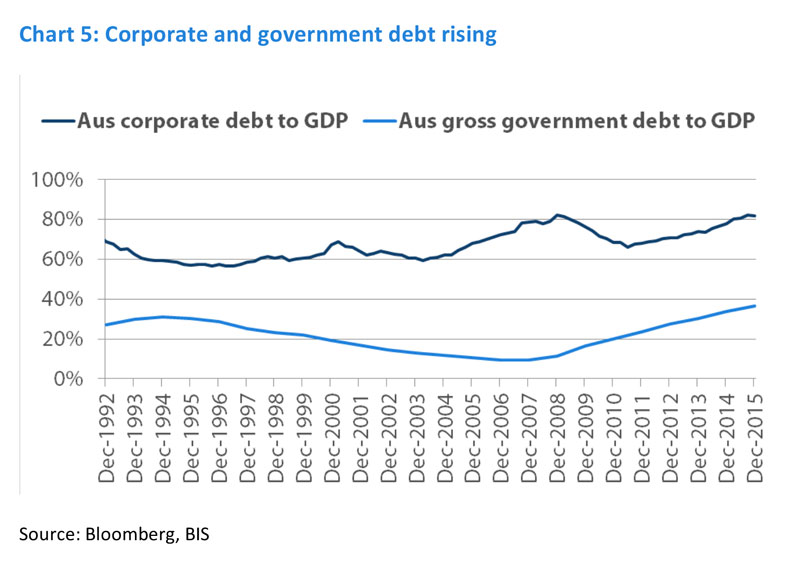
It is also appropriate to consider the economy-wide levels of debt. As can be seen in chart 5, rising leverage is not isolated to the household sector—it is also being seen in the corporate and government sectors. This would further complicate the RBA’s eventual return to a ‘normal’ 5% cash rate.
Lower cash rates should provide fixed income support
With interest rates at their current low levels, debt serviceability remains robust in the Australian economy. However, this dynamic will change quickly if interest rates were to rise. When the interest rate cycle turns and the RBA starts raising rates, it may be tempting to expect a return to ‘normal’ interest rates. However, in our view, this is unlikely—3% could well be the ceiling, as what was once deemed expansionary policy becomes contractionary. This means that interest rates should remain structurally lower for longer and that a sell-off in bonds in expectation of a return to ‘normal’ rates could provide opportunities to increase fixed income exposure.
For example, 10-year bond yields have typically ranged from 1.5% above to 1.5% below the prevailing cash rate (see chart 6). If we assume a spread in line with 2011, which was the end of the last RBA hiking cycle, this would place the 10-year bond at approximately 50 basis points over our estimated 3% top for the cash rate, so 3.5%. As a result, any bond sell-off based on a rise in domestic interest rates is unlikely to be as harsh as previously expected and should offer buying opportunities as the 10-year yield rises over 3%.

It is also worth noting that our expectation for 3% to become the new ceiling for the cash rate level is based on current interest rate and leverage levels. Should the RBA continue to ease, in line with market expectations, and households continue to borrow then the leverage ratio will also rise. This would mean that future rises in the cash rate would have an even stronger effect than in our current analysis. While a 3% cash rate would begin to stress borrowers today, if the debt load increases, then the ceiling for the cash rate could well become lower.
By Chris Rands, Portfolio Manager, Fixed Income
[1] APRA December 2014 letter to all Australian authorised deposit-taking institutions, REINFORCING SOUND RESIDENTIAL MORTGAGE LENDING PRACTICES
———-
Important Information: This material is issued by Nikko AM Limited ABN 99 003 376 252, AFSL 237563 (Nikko AM Australia). The information contained in this material is of a general nature only and does not constitute personal advice, nor does it constitute an offer of any financial product. It is for the use of researchers, licensed financial advisers and their authorised representatives, and does not take into account the objectives, financial situation or needs of any individual. The information in this material has been prepared from what is considered to be reliable information, but the accuracy and integrity of the information is not guaranteed. Figures, charts, opinions and other data, including statistics, in this material are current as at the date of publication, unless stated otherwise. The graphs, figures, etc., contained in this material include either past or backdated data, and make no promise of future investment returns, etc. Past performance is not an indicator of future performance. Any economic or market forecasts are not guaranteed. Any references to particular securities or sectors are for illustrative purposes only and are as at the date of publication of this material. This is not a recommendation in relation to any named securities or sectors and no warranty or guarantee is provided.


